Python Math: Describe linear regression
61. Linear Regression Describer
Write a Python program to describe linear regression .
Note : A linear regression line has an equation of the form Y = a + bX, where X is the explanatory variable and Y is the dependent variable. The slope of the line is b, and a is the intercept (the value of y when x = 0).
Sample Solution:
Python Code:
#https://gist.github.com/cartr/6513044
# Define the data
data = set()
count = int(input("Enter the number of data points: "))
for i in range(count):
    x=float(input("X"+str(i+1)+": "))
    y=float(input("Y"+str(i+1)+": "))
    data.add((x,y))

# Find the average x and y
avgx = 0.0
avgy = 0.0
for i in data:
    avgx += i[0]/len(data)
    avgy += i[1]/len(data)

# Find the sums
totalxx = 0
totalxy = 0

for i in data:
    totalxx += (i[0]-avgx)**2
    totalxy += (i[0]-avgx)*(i[1]-avgy)

# Slope/intercept form
m = totalxy/totalxx
b = avgy-m*avgx

print("Best fit line:")
print("y = "+str(m)+"x + "+str(b))

x = float(input("Enter a value to calculate: "))
print("y = "+str(m*x+b))
Sample Output:
Enter the number of data points: 2
X1: 1
Y1: 2
X2: 3
Y2: 4
Best fit line:
y = 1.0x + 1.0
Enter a value to calculate: 10
y = 11.0
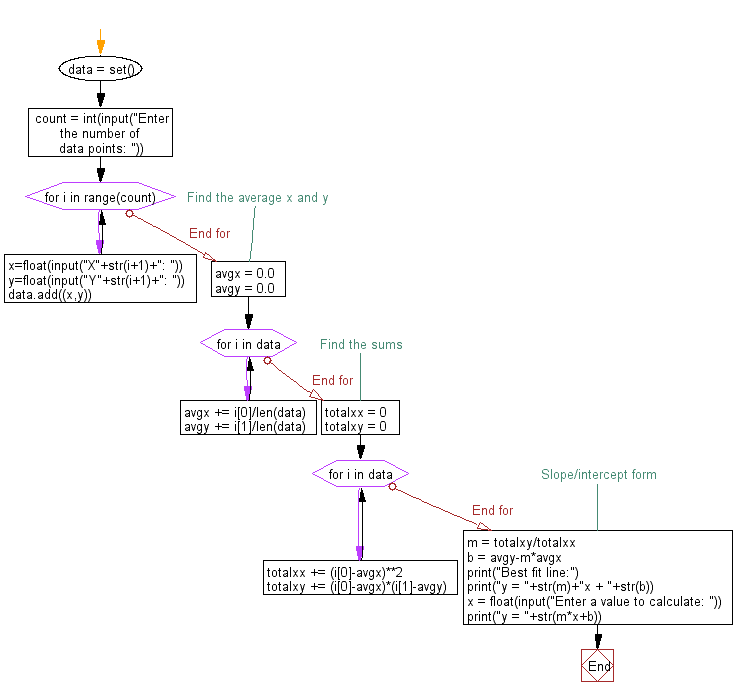
Flowchart:

For more Practice: Solve these Related Problems:
- Write a Python program to perform linear regression on a small dataset and print the best fit line in the format y = a + bx.
- Write a Python function that takes two lists (X and Y values) as input and returns the slope and intercept of the best fit line.
- Write a Python script to prompt the user for two data points, compute the linear regression line, and predict the value of Y for a given X.
- Write a Python program to compare the results of your linear regression calculation with numpy.polyfit() and print both equations.
Go to:
Previous: Write a Python program to parse math formulas and put parentheses around multiplication and division.
Next: Write a Python program to calculate a grid of hexagon coordinates of the given radius given lower-left and upper-right coordinates. The function will return a list of lists containing 6 tuples of x, y point coordinates. These can be used to construct valid regular hexagonal polygons.
Python Code Editor:
Have another way to solve this solution? Contribute your code (and comments) through Disqus.
What is the difficulty level of this exercise?
Test your Programming skills with w3resource's quiz.
