Create a 2D grid and solve a PDE with NumPy and SciPy
17. Solving PDEs on a 2D Grid
Write a NumPy program to create a 2D grid of data points and solve a partial differential equation (PDE) using SciPy's integrated module.
Sample Solution:
Python Code:
import numpy as np
from scipy.integrate import solve_bvp
import matplotlib.pyplot as plt

# Define the PDE as a system of first-order ODEs
def pde_system(x, y):
    return np.vstack((y[1], -np.pi**2 * y[0]))

# Define the boundary conditions
def boundary_conditions(ya, yb):
    return np.array([ya[0], yb[0]])

# Create a 2D grid of data points
x = np.linspace(0, 1, 100)
y_initial = np.zeros((2, x.size))

# Solve the boundary value problem (BVP)
solution = solve_bvp(pde_system, boundary_conditions, x, y_initial)

# Plot the solution
plt.plot(solution.x, solution.y[0])
plt.xlabel('x')
plt.ylabel('y')
plt.title('Solution of the PDE')
plt.grid(True)
plt.show()
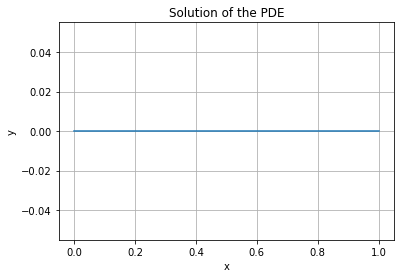
Output:
Explanation:
- Import libraries:
- Import the necessary modules from NumPy, SciPy, and Matplotlib.
- Define PDE:
- Define the partial differential equation as a system of first-order ordinary differential equations (ODEs).
- Boundary conditions:
- Define the boundary conditions for the PDE.
- Create 2D grid:
- Create a 2D grid of data points using NumPy.
- Initial guess:
- Set an initial guess for the solution.
- Solve BVP:
- Use SciPy's solve_bvp function to solve the boundary value problem.
- Plot solution:
- Plot the solution using Matplotlib for visualization.
For more Practice: Solve these Related Problems:
- Write a Numpy program to set up a 2D grid and solve Laplace's equation using SciPy's sparse linear solvers.
- Write a Numpy program to discretize a 2D domain and solve the heat equation using SciPy's integrate.solve_ivp.
- Write a Numpy program to simulate diffusion on a grid and compare the numerical solution with an analytical solution using SciPy.
- Write a Numpy program to implement finite difference methods on a 2D grid and solve a steady-state PDE with SciPy.
Go to:
PREV : Statistical Tests with SciPy Stats.
NEXT : Geometric Transformations with SciPy ndimage.
Python-Numpy Code Editor:
Have another way to solve this solution? Contribute your code (and comments) through Disqus.What is the difficulty level of this exercise?
Test your Programming skills with w3resource's quiz.

