Pandas Datetime: Create a plot of distribution of UFO observation time
20. Plot Distribution of UFO Observation Time
Write a Pandas program to create a plot of distribution of UFO (unidentified flying object) observation time.
Sample Solution:
Python Code:
import pandas as pd
import matplotlib.pyplot as plt
import seaborn as sns
df = pd.read_csv(r'ufo.csv')
df['duration_sec'] = (df['length_of_encounter_seconds'].astype(float))/60
s = df["duration_sec"].quantile(0.95)
temp = df['duration_sec']
temp = temp.sort_values()
temp = temp[temp < s]
plt.figure(figsize=(10, 8))
sns.distplot(temp)
plt.xlabel('Duration(min)', fontsize=20)
plt.ylabel("Frequency", fontsize=15)
plt.xticks(fontsize=12)
plt.title("-Distribution of UFO obervation time-", fontsize=20)
plt.show()
Sample Output:
C:\Users\User\Anaconda3\lib\site-packages\scipy\stats\stats.py:1713: FutureWarning: Using a non-tuple sequence for multidimensional indexing is deprecated; use `arr[tuple(seq)]` instead of `arr[seq]`. In the future this will be interpreted as an array index, `arr[np.array(seq)]`, which will result either in an error or a different result.
  return np.add.reduce(sorted[indexer] * weights, axis=axis) / sumval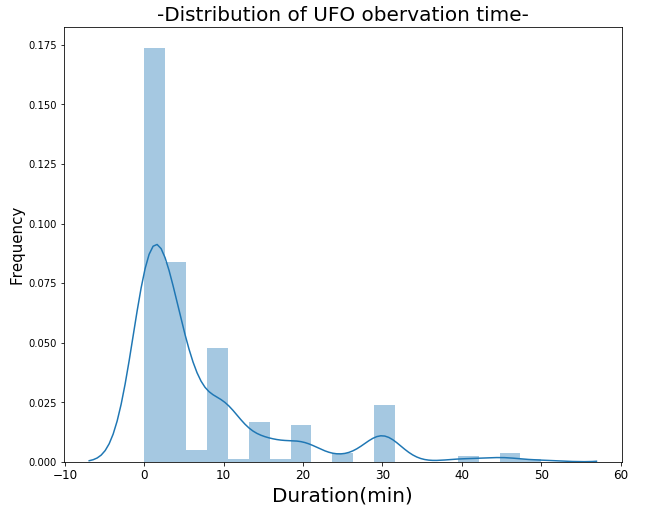
For more Practice: Solve these Related Problems:
- Write a Pandas program to create a histogram showing the distribution of UFO observation times from the dataset.
- Write a Pandas program to plot a density curve of the UFO observation times and analyze the distribution.
- Write a Pandas program to generate a bar plot that visualizes the frequency of UFO reports by observation hour.
- Write a Pandas program to create a time-of-day distribution plot for UFO sightings using the hour component extracted from reporting times.
Go to:
PREV : Check Missing Values in UFO DataFrame.
NEXT : Graphical Analysis of UFO Sightings by Month.
Python Code Editor:
Have another way to solve this solution? Contribute your code (and comments) through Disqus.
What is the difficulty level of this exercise?