Pandas Practice Set-1: Create a histogram of the 'carat' Series of diamonds DataFrame
37. Create a Histogram of the 'carat' Series
Write a Pandas program to create a histogram of the 'carat' Series (distribution of a numerical variable) of diamonds DataFrame.
Sample Solution:
Python Code:
import pandas as pd
diamonds = pd.read_csv('https://raw.githubusercontent.com/mwaskom/seaborn-data/master/diamonds.csv')
print("Original Dataframe:")
print(diamonds.head())
print("\nHistogram of the 'carat' Series (distribution of a numerical variable) of diamonds DataFrame.")
diamonds.carat.plot(kind='hist')
Sample Output:
Original Dataframe:
   carat      cut color clarity  depth  table  price     x     y     z
0   0.23    Ideal     E     SI2   61.5   55.0    326  3.95  3.98  2.43
1   0.21  Premium     E     SI1   59.8   61.0    326  3.89  3.84  2.31
2   0.23     Good     E     VS1   56.9   65.0    327  4.05  4.07  2.31
3   0.29  Premium     I     VS2   62.4   58.0    334  4.20  4.23  2.63
4   0.31     Good     J     SI2   63.3   58.0    335  4.34  4.35  2.75

Histogram of the 'carat' Series (distribution of a numerical variable) of diamonds DataFrame.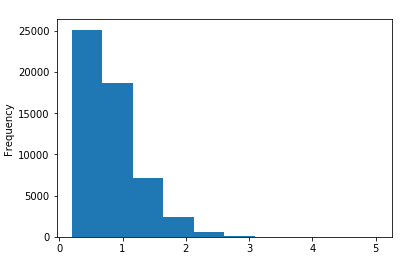
For more Practice: Solve these Related Problems:
- Write a Pandas program to plot a histogram of the 'carat' column with custom bin sizes and labels.
- Write a Pandas program to create a histogram for 'carat' and overlay a density curve for better visualization.
- Write a Pandas program to display a histogram of 'carat' values and then annotate the highest frequency bin.
- Write a Pandas program to plot a normalized histogram of the 'carat' series and compare it with a kernel density estimate.
Go to:
PREV : Calculate Summary Statistics of 'cut' Series.
NEXT : Create a Bar Plot of 'value_counts' for 'cut' Series.
Python Code Editor:
Have another way to solve this solution? Contribute your code (and comments) through Disqus.
What is the difficulty level of this exercise?