Grouping DataFrame by column and calculating mean in Python
Group a Pandas DataFrame by a column and calculate the mean of another column.
Sample Solution:
Python Code:
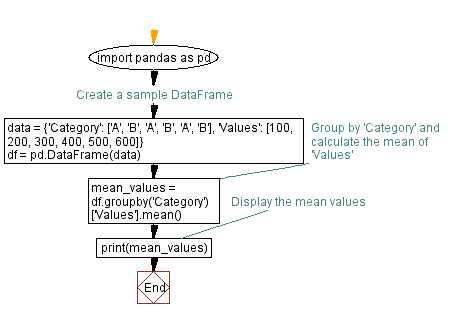
import pandas as pd

# Create a sample DataFrame
data = {'Category': ['A', 'B', 'A', 'B', 'A', 'B'],
        'Values': [100, 200, 300, 400, 500, 600]}

df = pd.DataFrame(data)

# Group by 'Category' and calculate the mean of 'Values'
mean_values = df.groupby('Category')['Values'].mean()

# Display the mean values
print(mean_values)
Output:
Category
A    300.0
B    400.0
Name: Values, dtype: float64
Explanation:
In the exerciser above -
- First we create a sample DataFrame (df) with columns 'Category' and 'Values'.
- The groupby('Category') method groups the DataFrame by the 'Category' column.
- The ['Values'].mean() part calculates the mean of the 'Values' column for each group.
- The result is a Pandas Series with the mean values for each category.
Flowchart:
Python Code Editor:
Previous: Calculating cumulative sum in Pandas DataFrame with NumPy array.
Next: Reshaping Pandas DataFrame with pivot_table in Python.
What is the difficulty level of this exercise?
Test your Programming skills with w3resource's quiz.