Normalizing numerical column in Pandas DataFrame with Min-Max scaling
Normalize a numerical column in a Pandas DataFrame.
Sample Solution:
Python Code:
import pandas as pd
# Create a sample DataFrame with a numerical column
data = {'Values': [10, 20, 30, 40, 50]}
df = pd.DataFrame(data)

# Define a function to perform Min-Max scaling
def min_max_scaling(column):
    min_val = column.min()
    max_val = column.max()
    scaled_column = (column - min_val) / (max_val - min_val)
    return scaled_column

# Apply Min-Max scaling to the 'Values' column
df['Normalized_Values'] = min_max_scaling(df['Values'])

# Display the normalized DataFrame
print(df)
Output:
   Values  Normalized_Values
0      10               0.00
1      20               0.25
2      30               0.50
3      40               0.75
4      50               1.00
Explanation:
In the exerciser above,
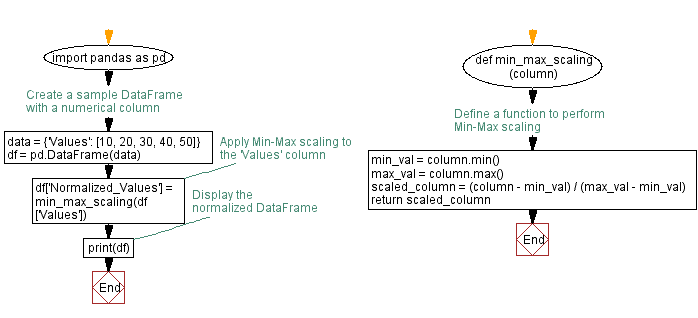
- First we create a sample DataFrame (df) with a numerical column 'Values'.
- The min_max_scaling function performs Min-Max scaling on a given column, scaling the values to the range [0, 1].
- Next we apply the min_max_scaling function to the 'Values' column and create a new column 'Normalized_Values' in the DataFrame.
- The resulting DataFrame (df) contains the original 'Values' column and the normalized 'Normalized_Values' column.
Flowchart:

Python Code Editor:
Previous: Creating Histogram with NumPy and Matplotlib in Python.
Next: Removing duplicate rows in Pandas DataFrame.
What is the difficulty level of this exercise?
Test your Programming skills with w3resource's quiz.
