Aggregating data in Pandas: Multiple functions example
Aggregate data in a DataFrame by multiple functions.
Sample Solution:
Python Code:
import pandas as pd

# Create a sample DataFrame
data = {'Department': ['HR', 'IT', 'Finance', 'IT', 'HR', 'Finance'],
        'Salary': [50000, 60000, 45000, 70000, 55000, 60000],
        'Experience': [2, 5, 1, 7, 3, 4]}

df = pd.DataFrame(data)

# Group by 'Department' and aggregate data with multiple functions
aggregated_df = df.groupby('Department').agg({
    'Salary': ['mean', 'sum'],
    'Experience': 'max'
}).reset_index()

# Display the aggregated DataFrame
print(aggregated_df)
Output:
  Department   Salary         Experience
                 mean     sum        max
0    Finance  52500.0  105000          4
1         HR  52500.0  105000          3
2         IT  65000.0  130000          7
Explanation:
Here's a breakdown of the above code:
- We create a sample DataFrame (df) with columns 'Department', 'Salary', and 'Experience'.
- The df.groupby('Department') groups the DataFrame by the 'Department' column.
- The agg() function is used to apply multiple aggregation functions to different columns. We calculate the mean and sum of 'Salary' and the maximum value of 'Experience'.
- The result is stored in the "aggregated_df" DataFrame, and "reset_index()" is used to make the 'Department' column a regular column instead of an index.
- The aggregated DataFrame is then printed.
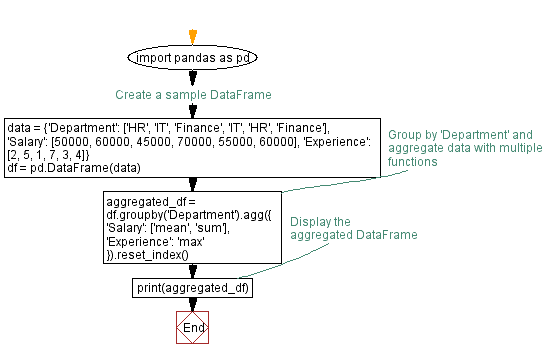
Flowchart:

Python Code Editor:
Previous: Merging Pandas DataFrames on multiple columns.
Next: Extracting date and time from Pandas DateTime.
What is the difficulty level of this exercise?
Test your Programming skills with w3resource's quiz.
