Rolling Calculation in Pandas DataFrame
Perform a rolling calculation on a numerical column in a DataFrame.
Sample Solution:
Python Code:
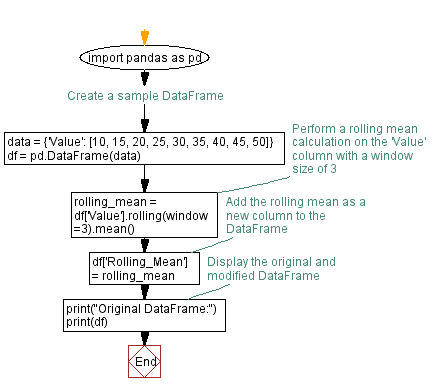
import pandas as pd

# Create a sample DataFrame
data = {'Value': [10, 15, 20, 25, 30, 35, 40, 45, 50]}
df = pd.DataFrame(data)

# Perform a rolling mean calculation on the 'Value' column with a window size of 3
rolling_mean = df['Value'].rolling(window=3).mean()

# Add the rolling mean as a new column to the DataFrame
df['Rolling_Mean'] = rolling_mean

# Display the original and modified DataFrame
print("Original DataFrame:")
print(df)
Output:
Original DataFrame:
   Value  Rolling_Mean
0     10           NaN
1     15           NaN
2     20          15.0
3     25          20.0
4     30          25.0
5     35          30.0
6     40          35.0
7     45          40.0
8     50          45.0
Explanation:
Here's a breakdown of the above code:
- We create a sample DataFrame (df) with a numerical column 'Value'.
- The df['Value'].rolling(window=3).mean() line calculates the rolling mean of the 'Value' column with a window size of 3.
- The resulting "rolling_mean" is added as a new column 'Rolling_Mean' to the original DataFrame.
- The modified DataFrame is then printed.
Flowchart:
Python Code Editor:
Previous: Resampling Time-Series in a Pandas DataFrame.
Next: Cross-Tabulation in Pandas: Analyzing DataFrame categories.
What is the difficulty level of this exercise?
Test your Programming skills with w3resource's quiz.