Cross-Tabulation in Pandas: Analyzing DataFrame categories
Perform a cross-tabulation between two columns in a DataFrame.
Sample Solution:
Python Code:
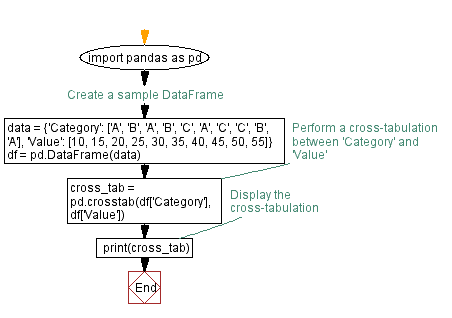
import pandas as pd

# Create a sample DataFrame
data = {'Category': ['A', 'B', 'A', 'B', 'C', 'A', 'C', 'C', 'B', 'A'],
        'Value': [10, 15, 20, 25, 30, 35, 40, 45, 50, 55]}

df = pd.DataFrame(data)

# Perform a cross-tabulation between 'Category' and 'Value'
cross_tab = pd.crosstab(df['Category'], df['Value'])

# Display the cross-tabulation
print(cross_tab)
Output:
Value     10  15  20  25  30  35  40  45  50  55
Category
A          1   0   1   0   0   1   0   0   0   1
B          0   1   0   1   0   0   0   0   1   0
C          0   0   0   0   1   0   1   1   0   0
Explanation:
Here's a breakdown of the above code:
- We create a sample DataFrame (df) with two columns: 'Category' and 'Value'.
- The pd.crosstab(df['Category'], df['Value']) line performs a cross-tabulation between these two columns.
- The resulting "cross_tab" DataFrame shows the frequency of each combination of 'Category' and 'Value'.
Flowchart:
Python Code Editor:
Previous: Rolling Calculation in Pandas DataFrame.
What is the difficulty level of this exercise?
Test your Programming skills with w3resource's quiz.