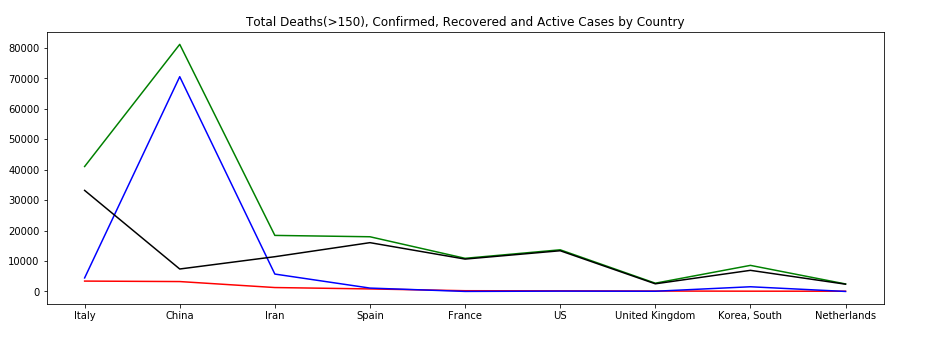
Python Exercise: Create a plot of total deaths, confirmed, recovered and active cases Country wise where deaths greater than 150
Write a Python program to create a plot (lines) of total deaths, confirmed, recovered and active cases Country wise where deaths greater than 150.
Sample Solution:
Python Code:
import pandas as pd
import matplotlib.pyplot as plt
covid_data= pd.read_csv('https://raw.githubusercontent.com/CSSEGISandData/COVID-19/master/csse_covid_19_data/csse_covid_19_daily_reports/03-19-2020.csv', usecols = ['Last Update', 'Country/Region', 'Confirmed', 'Deaths', 'Recovered'])
covid_data['Active'] = covid_data['Confirmed'] - covid_data['Deaths'] - covid_data['Recovered']

r_data = covid_data.groupby(["Country/Region"])["Deaths", "Confirmed", "Recovered", "Active"].sum().reset_index()
r_data = r_data.sort_values(by='Deaths', ascending=False)
r_data = r_data[r_data['Deaths']>50]
plt.figure(figsize=(15, 5))
plt.plot(r_data['Country/Region'], r_data['Deaths'],color='red')
plt.plot(r_data['Country/Region'], r_data['Confirmed'],color='green')
plt.plot(r_data['Country/Region'], r_data['Recovered'], color='blue')
plt.plot(r_data['Country/Region'], r_data['Active'], color='black')

plt.title('Total Deaths(>150), Confirmed, Recovered and Active Cases by Country')
plt.show()
Sample Output:
Python Code Editor:
Have another way to solve this solution? Contribute your code (and comments) through Disqus.
Previous: Write a Python program to get the top 10 countries data (Last Update, Country/Region, Confirmed, Deaths, Recovered) of Novel Coronavirus (COVID-19).
Next: Write a Python program to visualize the state/province wise death cases of Novel Coronavirus (COVID-19) in USA.
What is the difficulty level of this exercise?

