Build interactive charts and graphs with Python and Tkinter
Write a Python program that develops a program that uses the Canvas widget to draw a chart or graph (e.g., bar chart, pie chart) based on user-provided data using Tkinter.
Sample Solution:
Python Code:
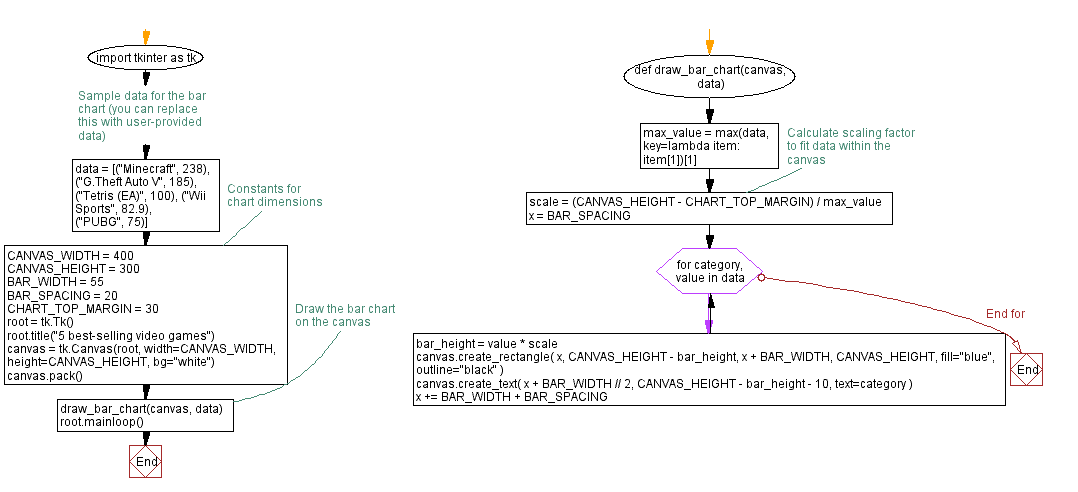
import tkinter as tk
# Sample data for the bar chart (you can replace this with user-provided data)
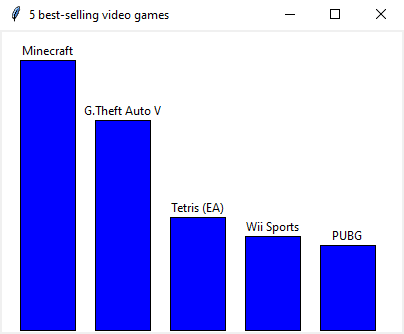
data = [("Minecraft", 238), ("G.Theft Auto V", 185), ("Tetris (EA)", 100), ("Wii Sports", 82.9), ("PUBG", 75)]
# Constants for chart dimensions
CANVAS_WIDTH = 400
CANVAS_HEIGHT = 300
BAR_WIDTH = 55
BAR_SPACING = 20
CHART_TOP_MARGIN = 30
def draw_bar_chart(canvas, data):
max_value = max(data, key=lambda item: item[1])[1]
# Calculate scaling factor to fit data within the canvas
scale = (CANVAS_HEIGHT - CHART_TOP_MARGIN) / max_value
x = BAR_SPACING
for category, value in data:
bar_height = value * scale
canvas.create_rectangle(
x, CANVAS_HEIGHT - bar_height, x + BAR_WIDTH, CANVAS_HEIGHT,
fill="blue", outline="black"
)
canvas.create_text(
x + BAR_WIDTH // 2, CANVAS_HEIGHT - bar_height - 10, text=category
)
x += BAR_WIDTH + BAR_SPACING
root = tk.Tk()
root.title("5 best-selling video games")
canvas = tk.Canvas(root, width=CANVAS_WIDTH, height=CANVAS_HEIGHT, bg="white")
canvas.pack()
# Draw the bar chart on the canvas
draw_bar_chart(canvas, data)
root.mainloop()
Explanation:
In the exercise above -
- Define sample data in the data list.
- Specify constants for chart dimensions, such as canvas width and height, bar width, bar spacing, and chart top margin.
- The "draw_bar_chart()" function takes the canvas and data as arguments and draws the bar chart on the canvas. In order to fit the chart within the canvas, it calculates a scaling factor based on the maximum value in the data.
- For each data point, draw rectangles (bars) on the canvas inside the function. The height of each bar is determined by the value scaled by the scaling factor.
- Label each bar with the corresponding category.
- Finally, create the Tkinter main window, create a canvas widget, and call the "draw_bar_chart()" function to draw the bar chart on the canvas.
Output:
Flowchart:
Go to:
Previous: Create a Mandelbrot Fractal image with Python and Tkinter.
Next: Python Tkinter canvas shape editor: Drawing and manipulating shapes.
Python Code Editor:
What is the difficulty level of this exercise?
Test your Programming skills with w3resource's quiz.