Pandas SQL Query: Display the ID for those employees who did two or more jobs in the past
21. Display IDs for Employees Who Had Two or More Past Jobs
Write a Pandas program to display the ID for those employees who did two or more jobs in the past.
JOB_HISTORY.csv
Sample Solution :
Python Code :
import pandas as pd
employees = pd.read_csv(r"EMPLOYEES.csv")
departments = pd.read_csv(r"DEPARTMENTS.csv")
job_history = pd.read_csv(r"JOB_HISTORY.csv")
jobs = pd.read_csv(r"JOBS.csv")
countries = pd.read_csv(r"COUNTRIES.csv")
regions = pd.read_csv(r"REGIONS.csv")
locations = pd.read_csv(r"LOCATIONS.csv")
result = job_history.groupby(['employee_id'])
print(result.filter(lambda x: len(x) > 1).groupby('employee_id').size().sort_values(ascending=False))
Sample Output:
employee_id
200    2
176    2
101    2
dtype: int64
Equivalent SQL Syntax:
SELECT employee_id
	FROM job_history
		GROUP BY employee_id
			HAVING COUNT(*) >=2;
Click to view the table contain:
For more Practice: Solve these Related Problems:
- Write a Pandas program to group JOB_HISTORY.csv by employee id, count the number of past jobs, and display those with two or more jobs.
- Write a Pandas program to display employee ids from JOB_HISTORY.csv that have a job count greater than or equal to 2, using groupby and filter.
- Write a Pandas program to compute the number of past jobs per employee and then sort the employee ids by the job count in descending order.
- Write a Pandas program to display employee ids along with their past job count for those with two or more jobs and visualize the distribution.
Go to:
PREV : Display Employees Not Working in Departments 50, 30, and 80.
NEXT : Calculate Minimum, Maximum, and Mean Salary .
Python Code Editor:
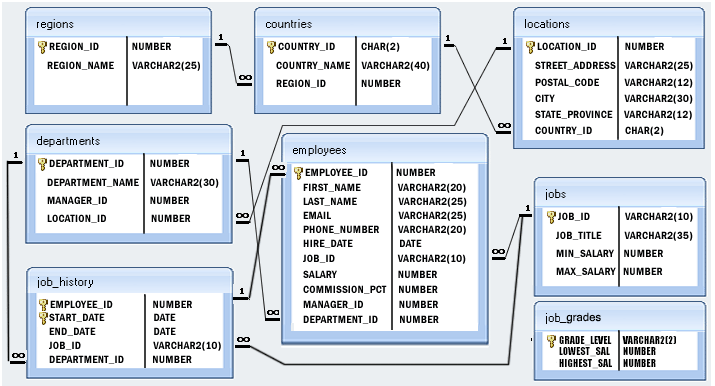
Structure of HR database :

Have another way to solve this solution? Contribute your code (and comments) through Disqus.
What is the difficulty level of this exercise?
